Zooming graphs
From Rave Documentation
(Redirected from Zooming Graphs)
Different workspace objects offer different options for zooming and setting axis limits. The following general rules apply:
Setting Axis Limits
- When creating a new graph for the first time, its axes will be zoomed using the default MATLAB settings. These ensure that all data is visible and then round the axis limits to the nearest tick mark.
- Axis limits that may be changed or zoomed are listed on the format tab. Some axes cannot be changed
- If you enter new values in the Axes Limits edit boxes on the format tab, the values you enter define the new "100% Zoom" level. If you subsequently zoom the graph, then reset the view, it will return to the values you entered in these boxes, not the default MATLAB values.
- You can reset the values you entered in the Format tab to the default MATLAB values by clicking the "Reset (X) Axis Limits" buttons on the format tab.
- The graph will also reset to the default MATLAB values whenever you change an option on the View Tab or take certain other actions that cause the graph to re-draw completely. However, you can override this and prevent the axes from changing by checking the "Always maintain axis limits" box on the format tab.
- Note: Even if this box is checked, clicking the "Reset (X) Axis Limits" buttons *will* still reset the axes to their default MATLAB values.
- For workspace objects that display multiple graphs, you can set their individual axis limits by first clicking on the desired graph while the Format tab is visible. If its axis limits can be changed, the axes will be highlighted in orange and their limits will show on the Format tab. Note that for some types of graphs (e.g. Scatter Plot Matrix) changing one axis's limits will also change other axes in the same row/column of the matrix.
Zooming
Zooming with the mouse
- Zooming has the same visual effect as setting axis limits. However, Rave considers zooming to be a separate operation. Zooming is treated as "temporary" and always allows you to easily reset to the axis limits described in the section above.
- Currently only the Line Plot and Scatter Plot allow zooming
- To zoom, simply right click and drag a rectangle on the graph to zoom to the corresponding area.
- To reset to the original axis limits, right click inside the graph and select "Reset View".
Zoom Bars
- Zoomable 2D graphs (currently only the Line Plot and Scatter Plot) also allow the addition of "Zoom Bars"
- To add Zoom Bars, select them from the menu on the Specialize Tab, then click the button that says "Click to Enable".
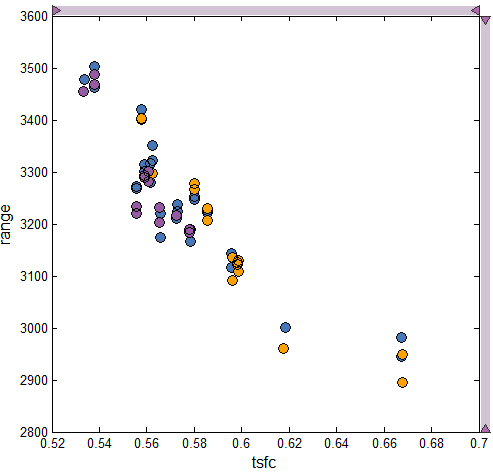
- The Zoom Bars will appear along the edges of the graph, as shown below:
- The graph may be zoomed by dragging the arrows at either end of the zoombars inward to define a reduced visible range for each axis.
- The graph may be panned by dragging the lighter colored bar connecting the arrows as if it were a scroll bar.
- Zooming the graph by other means (for example as described above in the Zooming with the Mouse section) will also cause the Zoom Bars to update to reflect the current zoom state at all times.
