MATLAB Renderers
Introduction
MATLAB has three methods of turning information into on-screen pixels, called "renderers." You can change which renderer Rave uses by clicking the change renderer button near the top-left of the window. No single renderer is great for everything, so depending on what you are doing you may need to use this button to fix bugs or improve performance. The properties of the renderers are hard coded into MATLAB, and there is nothing we can do to improve them.
The three renderers are Painters, ZBuffer, and OpenGL. The default renderer in Rave is "Painters."
Painters
Painters usually works well, but it is bad at rendering 3D scenes. If you are using 3D graphs, you may need to change to ZBuffer or OpenGL. Painters is also the slowest renderer, so if you are working with complex graphics you may get better performance if you change to another renderer.
General Properties:
- Slowest renderer, but is generally high quality and has essentially no bugs when drawing 2D graphs. Works regardless of your hardware.
- Sometimes draws 3D scenes incorrectly
- Anti-aliases text, but cannot anti-alias other graphics objects.
- Doesn't support transparency (hence Rave's general lack of support for transparency).
3D bugs
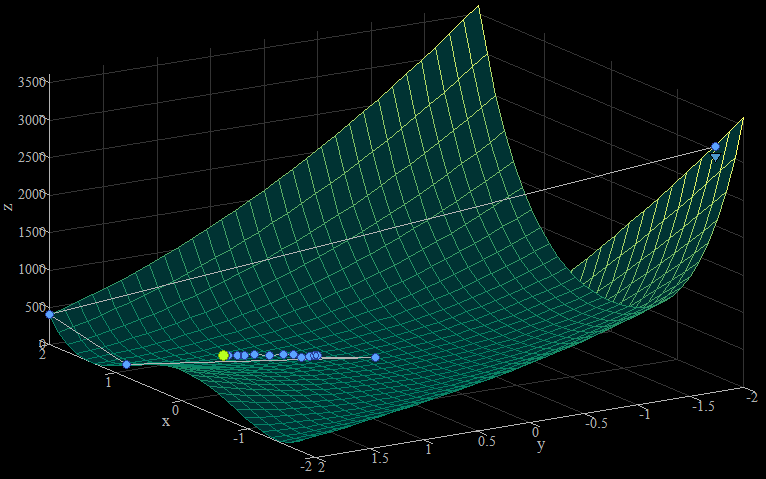
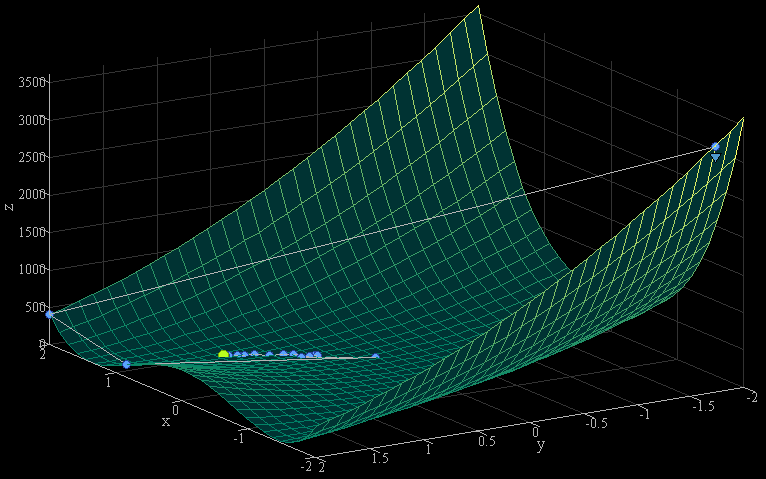
Painters often incorrectly draws 3D scenes so that objects that should be in the background end up in front. An example is shown here, where a surface plot of Rosenbrock's Valley is drawn incorrectly so that the peak near (-2,-2) seems to be behind the peak at (2,-2), even though the view angle of the graph clearly has (-2,-2) in the foreground.
Changing the renderer to ZBuffer fixes the bug:
ZBuffer
ZBuffer generally gives slightly lower quality results than Painters, but correctly renders 3D scenes.
General Properties:
- Faster than painters
- Renders 3D scenes correctly
OpenGL
OpenGL can be very good or very bad, depending on your graphics card. Unfortunately it has some very serious bugs that we cannot fix. In some situations, however, it can greatly speed up interaction with complex graphics. You are probably best off using it when you need to, and then switching back to Painters.
OpenGL is the only renderer that has options. You can change its behavior (to some extent) by setting the WVisual figure property. This may fix some bugs, or it may introduce new ones. You just have to try it and see.
General Properties:
- With a good graphics card, it can be VERY fast, even with really complex graphics.
- Has some very
Scrolling Bug
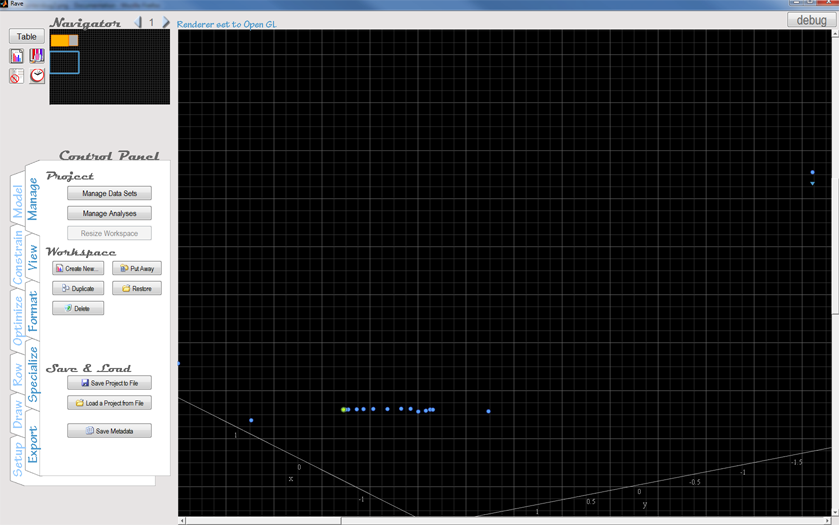
Unfortunately OpenGL has a severe bug that causes the contents of graphs that are scrolled off screen to just appear on screen, filling the entire visible workspace. There does not appear to be anything we can do to fix this. (It could theoretically be fixed by completely hiding all off-screen graphs as if they were on another page of the workspace, but the overhead of checking and moving graphs each time the workspace is scrolled probably makes this infeasible.)
This bug appears to affect all versions of MATLAB and every hardware configuration we have tested.
An example of this bug is shown below. Note that the explorer shows two graphs on the workspace, above the region currently in view. The bug is that the axes and some points from one of the graphs is overlayed on the workspace. As the workspace is scrolled, these stay stationary in the foreground. If the workspace is scrolled so that the graphs are actually visible on screen, then the superflous axes/lines disappear and everything works fine... the bug only occurs when graphs are off-screen.


