Rave: A New Way to Interact with Your Data
Rave is an open source MATLAB toolbox that provides point-and-click access to a wide variety of visualization, data analysis, optimization, and modeling capabilities. Rave was created by Matt Daskilewicz at Professor Brian German's research group at Georgia Tech's School of Aerospace Engineering to support engineering design decision making research, but its capabilities are general enough to be used in many other fields.
Rave is built to be easy to learn, easy to use, and easy for users to extend with new visualization, optimization, and other capabilities. Using Rave's existing capabilities requires no coding or prior experience with MATLAB, while new capabilities can be added by using a template-based interface that gives coders the maximum amount of flexibility in creating new functions.
Rave can be used with any "flat file" data set, or it can link directly to data-generating MATLAB functions or executables to enable interactive visualization and data mining, design steering, and user-in-the-loop optimization.
Rave is built on an easy-to-learn m-code interface that also lets you write your own visualization, exploration, optimization, and surrogate modeling functions and plug them in to Rave without modifying any of Rave's source code. This enables researchers working in these areas to leverage Rave's existing capabilities while developing code that can easily be shared with a broad user community.
Three Ways to Use Rave
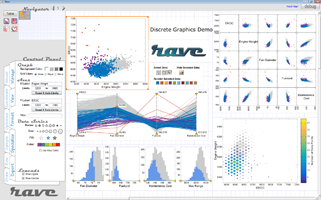
Rave gives you a "blank canvas" on which you can arrange graphs, tables, images, text, and user interface controls -- all automatically linked together and fully interactive -- to create anything from a simple scatter plot to a complex information dashboard.
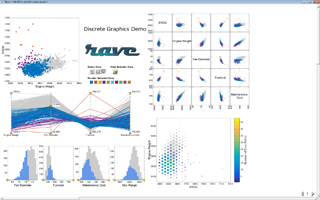
After you lay out your graphics, you can choose to hide Rave's user interface for a full screen view of the workspace that maximizes the screen space available for information visualization while maintaining the graphs' interactive capabilities. The full screen mode also lets you share your work in a cleaner, less cluttered presentation.
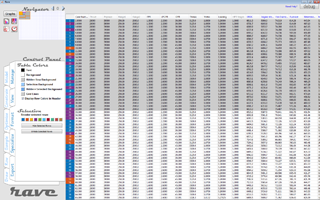
Sometimes, it's easier to work with a table than a graph, so Rave also offers a table view of your data that is editable and sortable and that offers data selection, filtering, and coloration that is linked to the graphs you place on the workspace.
Visualization
Rave includes over 20 types of multivariate visualizations for data sets and functions.
Exploration
Interactively select, recolor, and filter data. Graphics can be linked so changes made on one visualization can be seen in others.
Optimization
Define constraints and objective functions, then run single- or multi-objective optimizers and view progress animated on your graphs.
Decision Making
Automatically generate multi-objective utility functions, then specify your preferences interactively to rank competing designs.
Machine Learning
Create models of your data to enable data generation, continuous design space exploration, and faster optimization.
Design of Experiments
Generate DoE tables, then apply them to your functions to create input data for machine learning capabilities.
Download Rave
Rave requires MATLAB 2007b or later. If you have MATLAB, then you can download Rave for free on the downloads page.


